Go to ESRL Monthly/Seasonal Composite and follow the steps below:
1) Under ‘Which Variable?’, select the field you would like to plot.
![]()
2) Enter beginning and ending month of climatology (e.g. Jan to Jan for only January, Jun-Aug for NH summer, etc…).
![]()
3) Enter a range of years. For the long term climatology, enter maximum range possible as allowed by dataset.
![]()
Optionally, you can scale the plot to be larger than the default image size
![]()
4) Under ‘Map projection’, select ‘Latitude by height’ for a zonal average.
![]()
5) Enter lowest latitude as -90 and highest latitude as 90 to get the full globe.
![]()
Note, for omega (vertical velocity), you will need to set the upper level at 100mb.
![]()
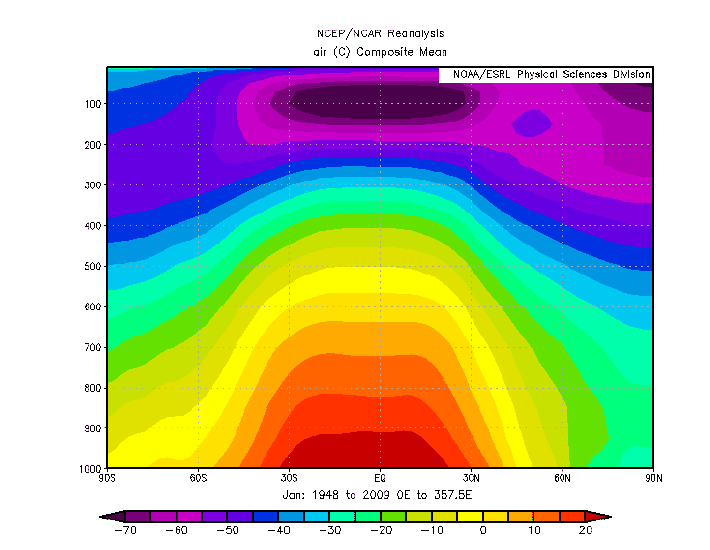
6) Click create plot. You should get something that looks similar to the figure below if you selected temperature as your variable.